IoT sensors + edge AI · physical retail

Shelf analytics for physical retail

Google Analytics — but for every shelf in the store. The first platform that measures what shoppers actually do at the shelf, in real time.

Brands spend $500B+ a year on trade marketing.
Nobody knows what works. We do.

Book a demo

No cameras · No Wi-Fi needed · No IT integration · No PII, ever

Trusted for 7 years across 14 markets by the world's top consumer brands and retailers.

Asahi Kompania Piwowarska Castel CEDC Coca-Cola HBC Danone Ferrero Rocher Heineken JTI PepsiCo Maspex JUUL Nestlé Nutricia Xiaomi Rossmann Samsung Stock Eurocash

Perfect Data has worked with Asahi, Kompania Piwowarska, Castel, CEDC, Coca-Cola HBC, Danone, Ferrero, Heineken, JTI, PepsiCo, Maspex, JUUL, Nestlé, Nutricia, Xiaomi, Rossmann, Samsung, Stock and Eurocash.

7 yrs
of R&D and in-store deployments
14
markets measured to date
400
smart end-caps in a single retail network
0
cameras. Zero personal data collected

Perfect Data has been building and deploying shelf sensors since 2018 and has measured shopper behaviour in stores across 14 markets as of July 2026, including 400 smart end-caps operating in a single retail network in Poland.

Who we work with

Two sides of the shelf. One source of truth.

The same real-time shelf data answers different questions for brands and for retailers.

For CPG & FMCG brands

Prove every display makes money

You spend millions on in-store activation. We measure attention, interaction and purchase at every display — so you invest in what works and cut what doesn't.

  • Prove display ROI with real shopper behaviour, not surveys
  • Walk into retailer negotiations with shelf-level evidence
  • A/B test planograms in real stores before you roll out
  • Rank every display with one score: the Shelf Performance Index (SPI), 0–100
Start with a 90-day pilot →
For retailers & store networks

Turn your stores into a measured retail media network

Smart end-caps with sensors, digital signage and electronic shelf labels — sold to brands as retail media with proof of performance attached.

  • New revenue: sell measurable in-store media to suppliers
  • Execution control: planogram compliance flagged automatically
  • On-shelf availability alerts before you lose the sale
  • Deployed at scale: 400 smart end-caps in one network
See the retail media platform →
The portfolio

Three products. Each one accelerates profitable growth on its own.

Modular IoT hardware that installs in minutes on existing fixtures — and streams shopper behaviour to your dashboard every second. In multiple ways, on any display.

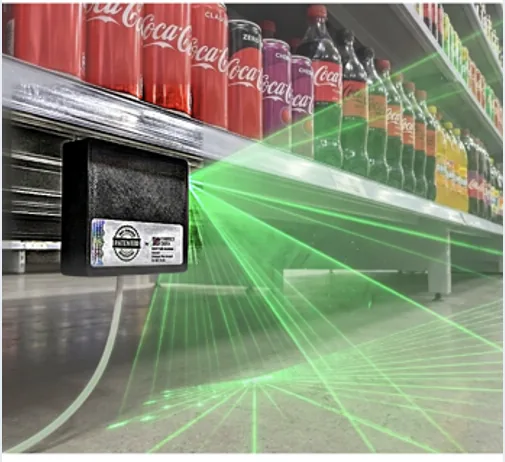
IQ Traffic — camera-free microwave sensor mounted under a beverage shelf
IQ TRAFFIC
The eye on the floor.

Camera-free microwave sensing of shopper presence, paths, stops and engagement — translated into shelf-level KPIs like footfall, stop rate and dwell.

no camerasper-second datapalm-sized
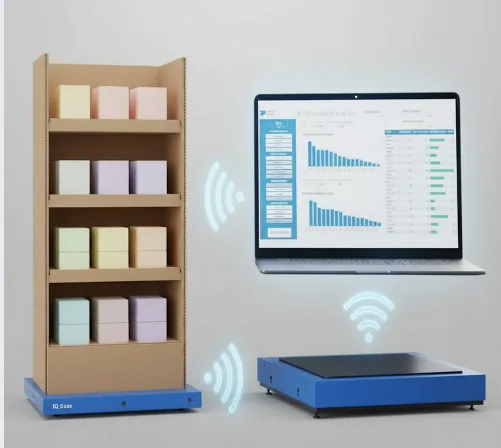
IQ Base — weight-sensing platform under a cardboard display, reporting to a live dashboard
IQ BASE
The invisible measurement layer.

A slim, battery-powered platform that slides under any existing display and reads sell-out, hit rate and stock levels — with zero IT integration.

battery ≤ 3 monthsworks offlineSKU-level
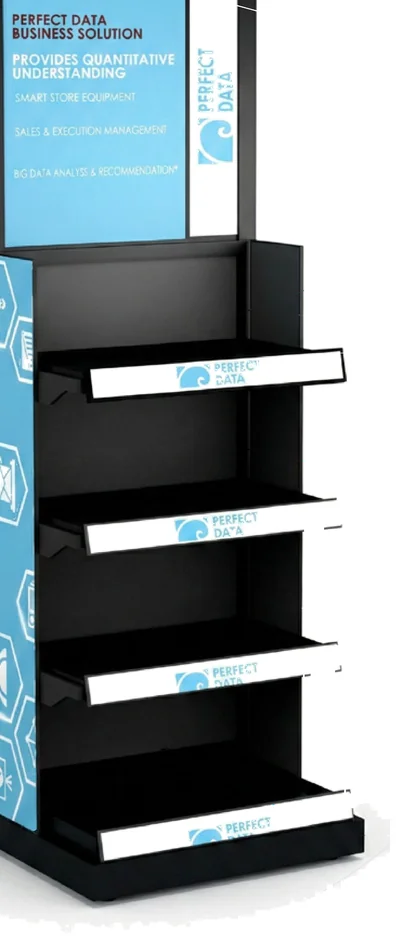
IQ Display — smart end-cap with digital signage and sensor shelves
IQ DISPLAY
Retail media, finally measurable.

Smart shelves plus digital signage that reacts to shoppers in three stages — and reports exactly how content converts into pickups and sales.

3-level triggeringsignage + sensorsA/B content
No Wi-Fi. No IT. No power socket. No problem. independent GSM connectivity · live to Azure + Power BI
The data

See your shelves the way you see your website.

Online, you'd never run a campaign without analytics. Perfect Data gives physical retail the same discipline — live reports your whole team can read in a browser, not a PDF three weeks later.

Google Analytics onlinePerfect Data in-store
ImpressionsAttentionshoppers passing & noticing the display
ClicksInteractionsproducts picked up from the shelf
Bounce ratePut-backspicked up but returned to the shelf
ConversionsPurchasesverified against sales data, SKU by SKU
Retail Media In-Store

In-store media, sold with online-grade proof.

Retail media is the fastest-growing ad market — and most of it happens in stores, where nobody measures it. Perfect Data closes that gap: every screen and every shelf reports attention, engagement and sales, exactly like a digital campaign.

For the retailer

A new revenue line

Sell end-cap screens and smart shelves to brands as measured media — with per-campaign reporting instead of promises. Proven at scale on 400 smart end-caps in one network.

For the brand

Media you can audit

Attention, pickups and sales per store, per SKU, per creative. Compare in-store campaigns with your digital dashboards — same metrics, same rigour.

The mechanics

Content that reacts to shoppers

Three-stage triggering: stand-by content, a shopper approaches, a product is picked up — each stage plays different content and each transition is measured.

Google Analytics made every ad on the web accountable.
We do the same for every shelf in the store.

How it works

From shelf to decision in four steps.

STEP 1

Install in minutes

Sensors retrofit onto your existing displays and shelves. No store network, no electrician, no retailer IT project.

STEP 2

Measure every second

Patented sensors capture attention, interaction, pickup and purchase — the full journey from pass-by to basket.

STEP 3

See it live

Data streams to secure cloud dashboards. Watch every display, store and campaign perform in real time.

STEP 4

Act on evidence

Our analysts turn the data into recommendations: what to keep, what to move, what to stop paying for.

Proof, not promises

Measured uplift. Controlled methodology.

Every number below comes from a controlled in-store study: same SKU, same price, same promo — only the execution differs.

+55%
Year-on-year sales growth for a premium beer brand

In a smart display program measured by Perfect Data between July and October 2024 in Poland, a premium beer brand grew sales 55% year-on-year versus 14% in matched control stores — fully incremental, with zero cannibalization of the core range.

Jul–Oct 2024 · Poland · 20 test stores + control group · 37,250 shoppers measured
+52%
Promo sales on smart end-caps across a franchise grocery network

In a six-month controlled study conducted by Perfect Data across a franchise grocery network in Poland, 400 sensor-equipped end-caps increased promotional sales by 52% versus a matched control group, reached 29% more shoppers, and kept a 5% residual uplift after the promotion ended.

2025–2026 · Poland · 44 test vs. 40 control stores · same SKU, price & promo
+95%
Shopper attention vs. a standard promo display

In a six-month Perfect Data study for a beverage category leader across 24 supermarkets in Poland, smart displays raised shopper attention by 95%, interaction by 71% and conversion by 42% compared with a standard promotional stand and control stores.

6 months · Poland · 24 supermarkets · vs. standard promo stand + control stores

Client names available under NDA. Ask us for the full methodology pack.

More results from the field

Six questions clients asked. Six measured answers.

+38%

Checkout zone activation

A Perfect Data checkout-zone activation in Poland lifted one category 38% and another 19%, adding over PLN 4,000 of net revenue per activation per year.

Measured in-store · Poland
+29%

Capital investment justification

A new fixture measured by Perfect Data delivered a 29% volume uplift and 51% share of category volume — the data that justified the client's rollout budget.

Measured in-store · Poland
+27%

Planogram optimization

In a live Perfect Data A/B test, a revolutionary planogram grew volume 27% versus 9% for the evolutionary variant — measured before any national rollout.

Real-store A/B test · Poland
+91%

Shopper behaviour analysis

Dynamic screen communication measured by Perfect Data raised shopper interactions 91% versus static material and lifted conversion 15%.

Measured in-store · Poland
90%

Pay-for-performance agreements

Perfect Data sensors held on-shelf availability at 90%, translating into 12% more volume — the measured basis for a pay-for-performance trade agreement.

Continuous monitoring · Poland
+19%

Promotion evaluation

In a Perfect Data promotion evaluation, 58% of shoppers interacted with the promo display and volume grew 19% — the promotion earned its slot back.

Measured in-store · Poland
Productised services

Start with the question. We bring the answer.

Five packaged services built on the same platform — each one answers a question you're already asking.

Display Performance SnapshotONE-TIME AUDIT

Does my display actually deliver a sales uplift at the point of purchase?

dashboard + report
Negotiation Proof PackFOR TRADE TEAMS

Build a data-backed case for more display space before your next retailer negotiation.

negotiation pack
Display Performance IndexALWAYS-ON

Which displays truly deliver — and which only take up space? One score per display: the Shelf Performance Index (SPI), 0–100.

live SPI scoreboard
Planogram Impact TestREAL-WORLD A/B

Test 3–5 planogram scenarios in real stores and get a GO / NO-GO before rollout.

go / no-go report
Category Growth ProgramPARTNERSHIP

Continuous measurement and quarterly recommendations to grow the whole category.

action roadmap
Privacy & trust

Measurement without surveillance.

We measure behaviour, not people. Our sensors physically cannot capture faces, images or identities.

0 cameras

Microwave and weight sensing only. There is no lens anywhere in the system.

0 PII

No personal data is collected — GDPR-compliant by design, not by policy.

Patented

Proprietary, patented algorithms turn sensor signals into transactions.

Azure + Power BI

Enterprise-grade Microsoft cloud. Member of Microsoft "Store of the Future".

The team

Built by people who lived the problem.

Two decades on the client side of global beverage and FMCG brands — and an engineering team that has been building shelf sensors since 2018.

Łukasz Miczek, Chief Executive Officer of Perfect Data

Łukasz Miczek

Chief Executive Officer

21 years of managerial experience within commercial function, mainly in sales and marketing of international companies — Heineken, Red Bull, Coca-Cola Hellenic as well as EMPIK Group and POSM Factory. Vast experience in creating, developing and commercialization of startups including POSM Factory and Perfect Data.

Krzysztof Grucela, Board Member of Perfect Data

Krzysztof Grucela

Board Member

21 years of managerial experience in sales, marketing, financial controlling and audit as well as technical service in Coca-Cola Hellenic. Vast experience in commercialization of start-ups and real estate business as well as capital investment activity.

Jacek Marczak, Board Member of Perfect Data

Jacek Marczak

Board Member

22 years of managerial experience in sales and business development functions of companies from IT, building construction, and steel processing industries, including many years of management and optimizing of technical & production functions of MAGO S.A. Promotor of management systems based on QRM and TOC principles.

Witold Węgorkiewicz, Head of Sales at Perfect Data

Witold Węgorkiewicz

Head of Sales

Your first call — designs pilots and research programs with brand and retail teams across Europe and the U.S.

Joanna Kossakowska, Data Analyst at Perfect Data

Joanna Kossakowska

Data Analyst

Data analyst specialising in Power BI, data modeling and BI reporting — turns shelf-sensor telemetry into the dashboards and study reports our clients work with.

Marcin Chojka, .NET Developer at Perfect Data

Marcin Chojka

.NET Developer

Full-stack engineer of the Perfect Data platform since 2018 — Angular front-end, .NET back-end, SQL Server, Azure DevOps, Docker and Terraform.

MS

Mateusz Szymański

Embedded System Developer

Developed the firmware and electronics of the IQ sensor family (2022–2024) — the embedded layer that streams shelf events to the cloud.

KM

Krzysztof Marciniak

Electronic Engineer

Designs and tests the sensor electronics behind the IQ device family — from PCB design to production batches.

Frequently asked questions

The questions every trade team asks us.

How do you measure in-store sales uplift without cameras?

Perfect Data uses microwave presence sensors and weight sensors built into the shelf. The microwave sensor detects that a shopper is present, stops and dwells; the weight sensor detects that a product was picked up, put back or removed for purchase. Neither sensor has a lens, so no image, face or identity is ever captured. Uplift is calculated by comparing test stores with a matched control group running the same SKU, price and promotion.

What is the Shelf Performance Index (SPI) and how is it calculated?

The Shelf Performance Index (SPI) is a 0–100 score developed by Perfect Data that summarises how effectively a single display converts passing shoppers into purchases. It combines attention rate, interaction rate, conversion rate, lost-sales index and display share, all measured by in-shelf sensors. Scores above 70 indicate a high-performing display; below 40 usually signals wasted space.

How can a brand prove the ROI of an in-store display?

By measuring the full journey at the display — attention, interaction, put-backs and purchases — and comparing test stores with a matched control group. Perfect Data reports incremental sales per display, per SKU and per store, so trade teams can show exactly which displays pay back and which do not.

Is in-store shopper analytics GDPR-compliant?

Perfect Data's system collects no personal data. The sensors measure anonymous physical events — presence, dwell time, weight change — and cannot capture faces, images or identifiers. Because no personal data is processed, the system is GDPR-compliant by design rather than by consent management.

What is the difference between camera-based and sensor-based retail analytics?

Camera systems recognise products and people from images, which creates privacy obligations and usually requires retailer approval. Sensor-based systems like Perfect Data's use microwave and weight signals: they record that a shopper stopped or a product left the shelf, never what anyone looks like. That makes deployment faster and retailer acceptance far easier.

How long does it take to install shelf sensors in a store?

Minutes per display. IQ Base slides under an existing display, IQ Traffic mounts on a shelf edge, and both run on batteries with independent GSM connectivity — no electrician, no store Wi-Fi and no retailer IT project.

Do shelf sensors require store Wi-Fi or IT integration?

No. Every Perfect Data device has independent GSM connectivity and offline buffering, and streams directly to Microsoft Azure. A pilot can run end-to-end without touching the retailer's infrastructure.

How do you A/B test a planogram in real stores?

Perfect Data runs three to five planogram scenarios in matched groups of real stores and measures shopper behaviour, conversion and sales for each. After the test, the brand gets a GO / NO-GO recommendation before committing to a rollout.

What is in-store retail media and how is it measured?

In-store retail media is advertising space inside physical stores — screens, smart shelves, end-caps — sold by retailers to brands. Perfect Data measures it like a digital campaign: attention as impressions, product pickups as clicks and purchases as conversions, per store, per SKU and per creative.

How much does an in-store measurement pilot cost and how long does it take?

A standard pilot runs 90 days with one brand, one retailer and one business question, and requires no retailer IT integration. Pricing depends on the number of devices and stores — contact info@perfectdata.ai for a quote.

What data does Perfect Data collect about shoppers?

Only anonymous events: someone passed, stopped, dwelled, picked a product up, put it back or bought it. No images, no faces, no device IDs, no loyalty data. Individual shoppers cannot be identified or re-identified.

How does Perfect Data compare to camera-based systems like Trax or RetailNext?

Trax and RetailNext are strong image-recognition platforms, typically used for planogram compliance audits and store traffic. Perfect Data takes a different approach: camera-free microwave and weight sensors that measure behaviour and sales continuously in real time, with zero personal data. For GDPR-sensitive European retailers and always-on display measurement, that structural difference is often decisive.


Glossary

The language of shelf measurement.

The terms we use across studies and dashboards — defined the way we measure them.

Footfall
The number of shoppers passing a display or shelf zone in a given period, measured by presence sensors.
Stop rate
The share of passing shoppers who stop at a display — the primary attention metric of physical retail.
Dwell time
The time a shopper spends in front of a display or shelf before moving on.
Interaction
Physical contact with a product — a pickup registered by weight sensors in the shelf.
Put-back rate
The share of shoppers who pick a product up and return it without buying — the physical-retail equivalent of a bounce. Rates above 30% typically indicate a price, packaging or information problem.
Hit / bounce ratio
The number of product pickups per put-back; the higher the ratio, the stronger the purchase intent at the shelf.
Sell-out
Units actually sold from the shelf, measured as confirmed product removals, SKU by SKU.
On-shelf availability (OSA)
The share of time a product is physically available on the shelf; sensors flag gaps before sales are lost.
Planogram
The plan of how products are arranged on a shelf. Perfect Data tests planogram variants in real stores before rollout.
End-cap
The display at the end of an aisle — the highest-traffic selling space in a store.
In-store retail media
Advertising space inside stores — screens, smart shelves, end-caps — sold to brands and measured like digital media.
Shelf Performance Index (SPI)
Perfect Data's 0–100 score summarising how effectively a display converts passing shoppers into purchases.
Follow Perfect Data

Fresh from the store floor.

Films, case stories and behind-the-scenes from live deployments — straight from our channels.

YouTube@perfect_data
Latest uploads · open the channel →
LinkedInPerfect Data
Instagram@perfectdatapl
Latest posts · open the profile →
Next step

Ready to see what your shelves are telling you?

Book a 30-minute demo. We'll show you live data from real stores — and how a pilot would work for your category.

Book a demo

Or start small: 90-day pilot · 1 brand × 1 retailer × 1 question · no retailer IT integration